He wants to share the places that he’s gone to watch for birds for his friends abroad.
Then they will know where to go when they come to Nigeria for a tour.
Dayo doesn’t know a lot on web development but he has played around with R Shiny.
But, he hasn’t recorded any data of his trip. So first he will need to get some data on bird observations.
Pecking out the data
Lucky for him, there is a dataset on bird observations 1 on GBIF 2, the Global Biodiversity Information Facility.
After downloading the dataset, Dayo set out to clean the dataset as much as he can and saved it online.
The plan
After looking at the structure of the dataset, Dayo decided to make a dashboard that showed the bird-watching sites and the birds that could be seen in all those sites during the year 2021.
Refresher on Shiny and reactivity
Shiny is a framework for creating web applications using R code. There are two components to a Shiny application: the ui (user interface) and the server (business logic).
The logic of the server is defined through reactive programming where the connections between inputs and outputs are defined in a graph.
library(shiny)ui <-fluidPage(# front end interfacetextInput("name", "What's your name?"),textOutput("greeting"))server <-function(input, output, session) {# back end logic output$greeting <-renderText({paste0("Hello ", input$name, "!") })}shinyApp(ui, server)
Best way to show a map? Make it interactive
Enter
Installing leaflet
install.packages("leaflet")
The starting point of a leaflet map is …
the function leaflet()
This returns a Leaflet map widget, which stores a list of objects that can be modified or updated later. We can also update the properties of the leaflet map such as the minimum and maximum zoom level and the rendering engine between SVG and Canvas.
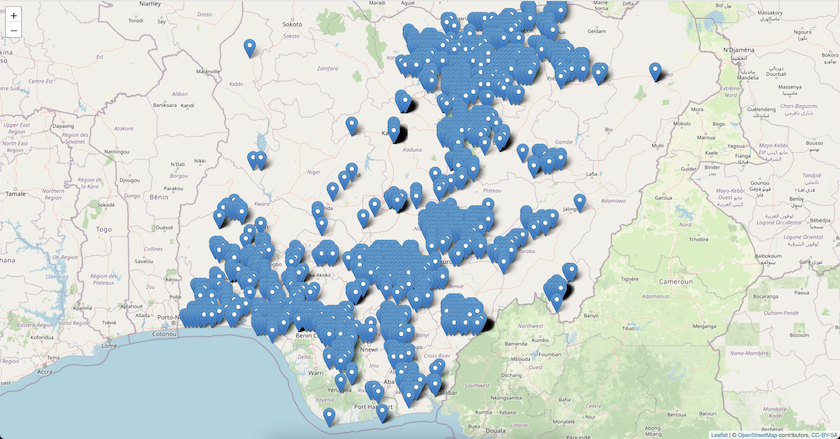
Just the leaflet function alone will not show anything meaningful. To add an actual view of the world we need to add tiles of world map on it. Right now, Dayo wants to focus on his homeland Nigeria.
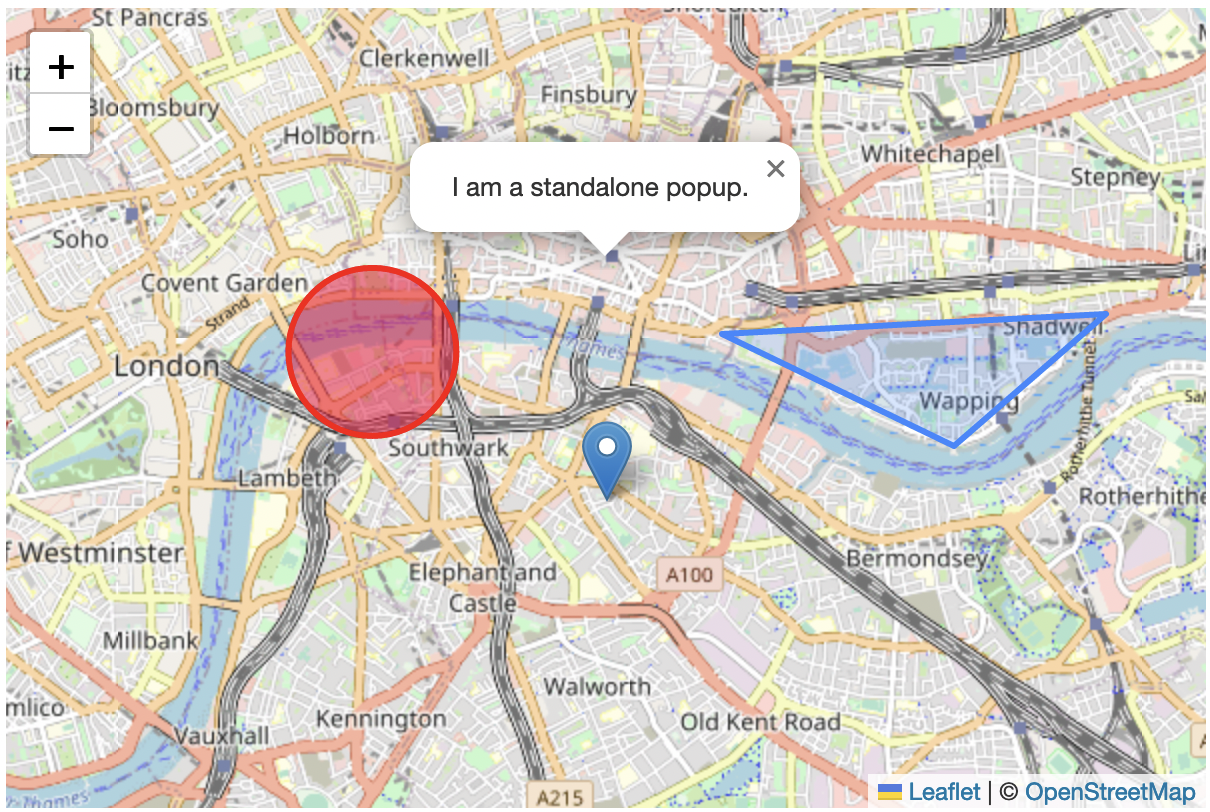
Dayo was not sure whether he needs an entire marker to showcase the site orif a simple dot would suffice. For that, he decided to give CircleMarkers a try. There’s also the option to draw circles as shapes on the map.
makeCircles() are similar to makeCircleMarkers()
The only difference is that circles have their radius specified in meters, while circle markers are specified in pixels making circles scale with zoom level.
library(shiny)library(leaflet)library(reactlog)reactlog_enable()df <- arrow::read_parquet("data/data.parquet") %>% dplyr::filter(year ==2021)ui <-bootstrapPage( tags$style(type ="text/css","html, body {width:100%;height:100%}"),# front end interfaceleafletOutput("map",width="100%",height="100%"),absolutePanel(bottom =10,right =10,sliderInput("day_month","Select Day of year",min =as.Date("2021-01-01","%Y-%m-%d"),max =as.Date("2021-12-31","%Y-%m-%d"),value=c(as.Date("2021-01-01"),as.Date("2021-12-31")),timeFormat="%Y-%m-%d")))server <-function(input, output, session) {# back end logic data_reactive <-reactive({ df %>% tidyr::unite("sight_date", year,month,day,sep="-") %>% dplyr::mutate(sight_date =as.Date(sight_date)) %>% dplyr::filter(sight_date > input$day_month[1], sight_date < input$day_month[2]) }) output$map <-renderLeaflet({leaflet(data =data_reactive()) %>%addTiles() %>%addMarkers(~decimalLongitude, ~decimalLatitude) })}shinyApp(ui, server)
Demo
leafletProxy
In the above example, the Shiny application redraws the entire map each time and that is time-consuming. So we need to divide the basemap and the reactive components separately using leafletProxy(). The following changes will have to be made in the server function.
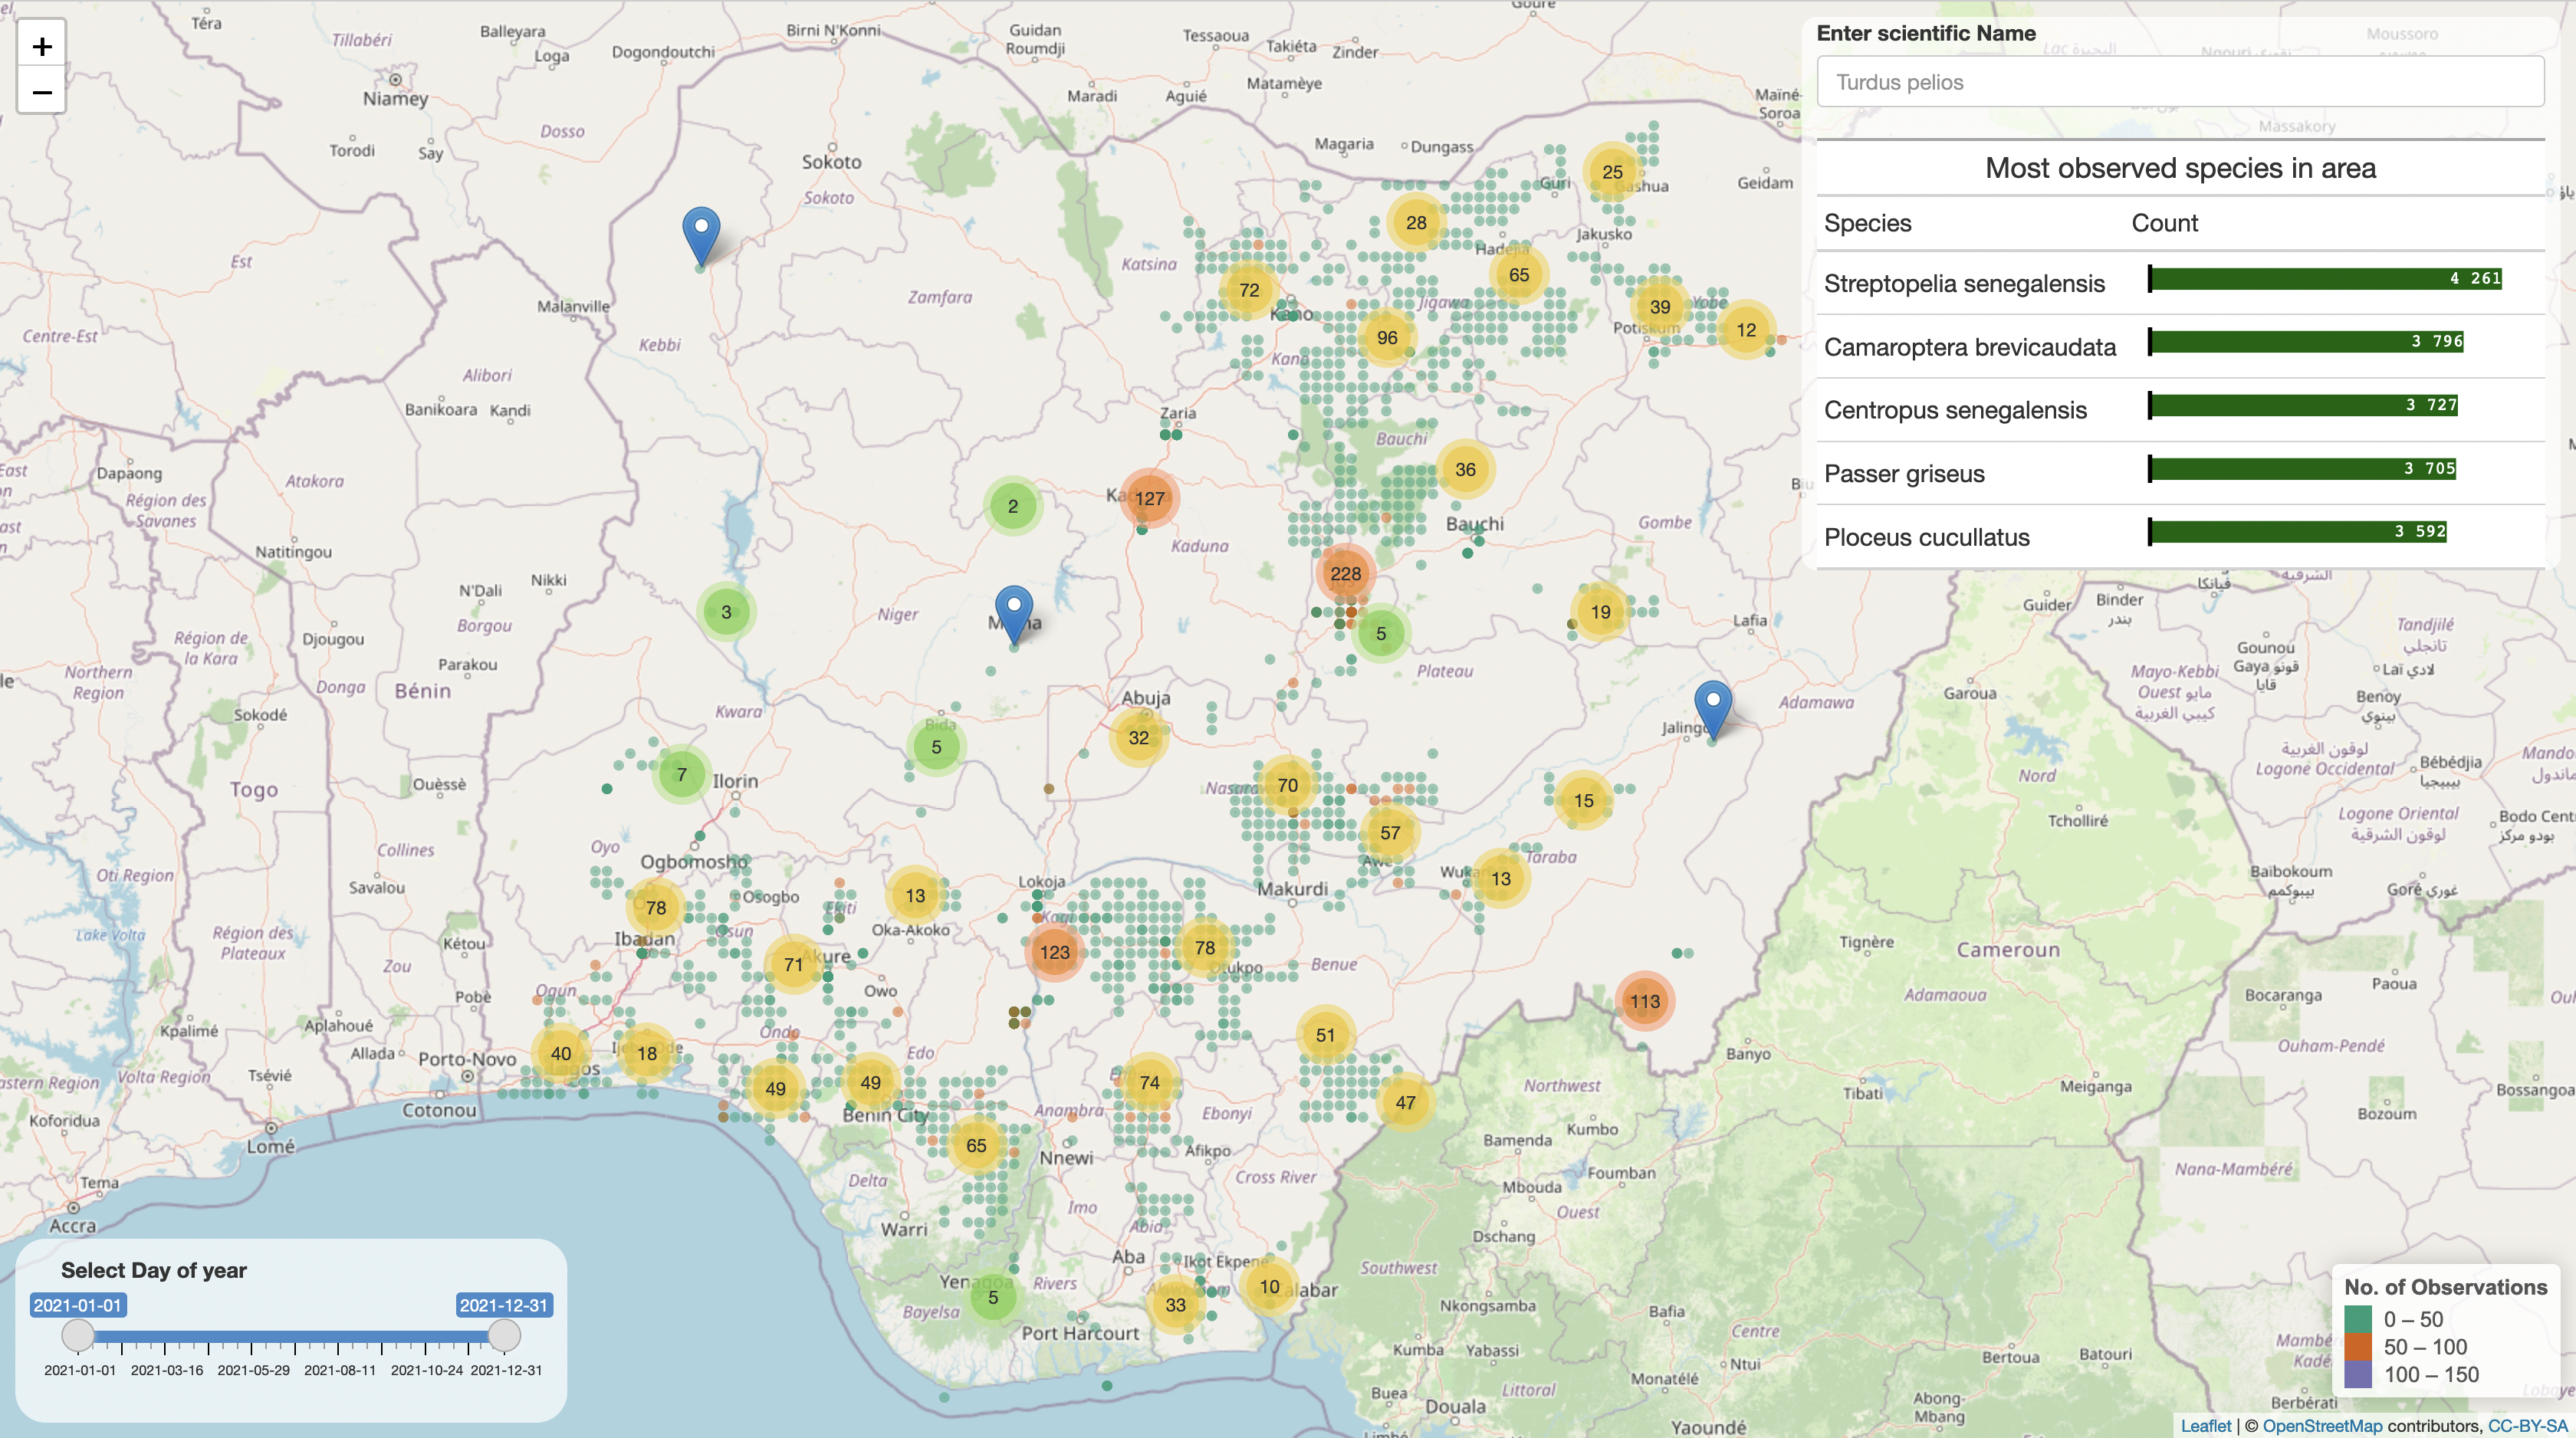
Now Dayo wants to display a table containing the scientific names of the top 10 most popular birds in the area. For that, he can use the events coming in from the map such as the bounds of the currently viewed map area.
input$MAPID_bounds provides the latitude/longitude bounds of the currently visible map area; the value is a list() that has named elements north, east, south, and west.
# data to use to generate the gt tabledf_bounds <-reactive({if (is.null(input$map_bounds))return(df[FALSE,]) bounds <- input$map_bounds latRng <-range(bounds$north, bounds$south) lngRng <-range(bounds$east, bounds$west)subset(df, decimalLatitude >= latRng[1] & decimalLatitude <= latRng[2] & decimalLongitude >= lngRng[1] & decimalLongitude <= lngRng[2])})output$species_in_area <-renderTable({df_bounds() %>%select(species_list) %>%separate_rows(species_list,sep =",") %>%count(species_list,sort=T,name ="Count") %>%slice_max(Count,n=10)})
Demo
Getting events
Displaying the list of species in a site
Following his success in getting the map bounds, Dayo decided to add the functionality to get the list of species in a site by clicking on a marker. He could use the marker events given by leaflet but before that he needs to define ids for each site.